Data Visualization Consulting Services | Data Analysis Services Atlanta GA
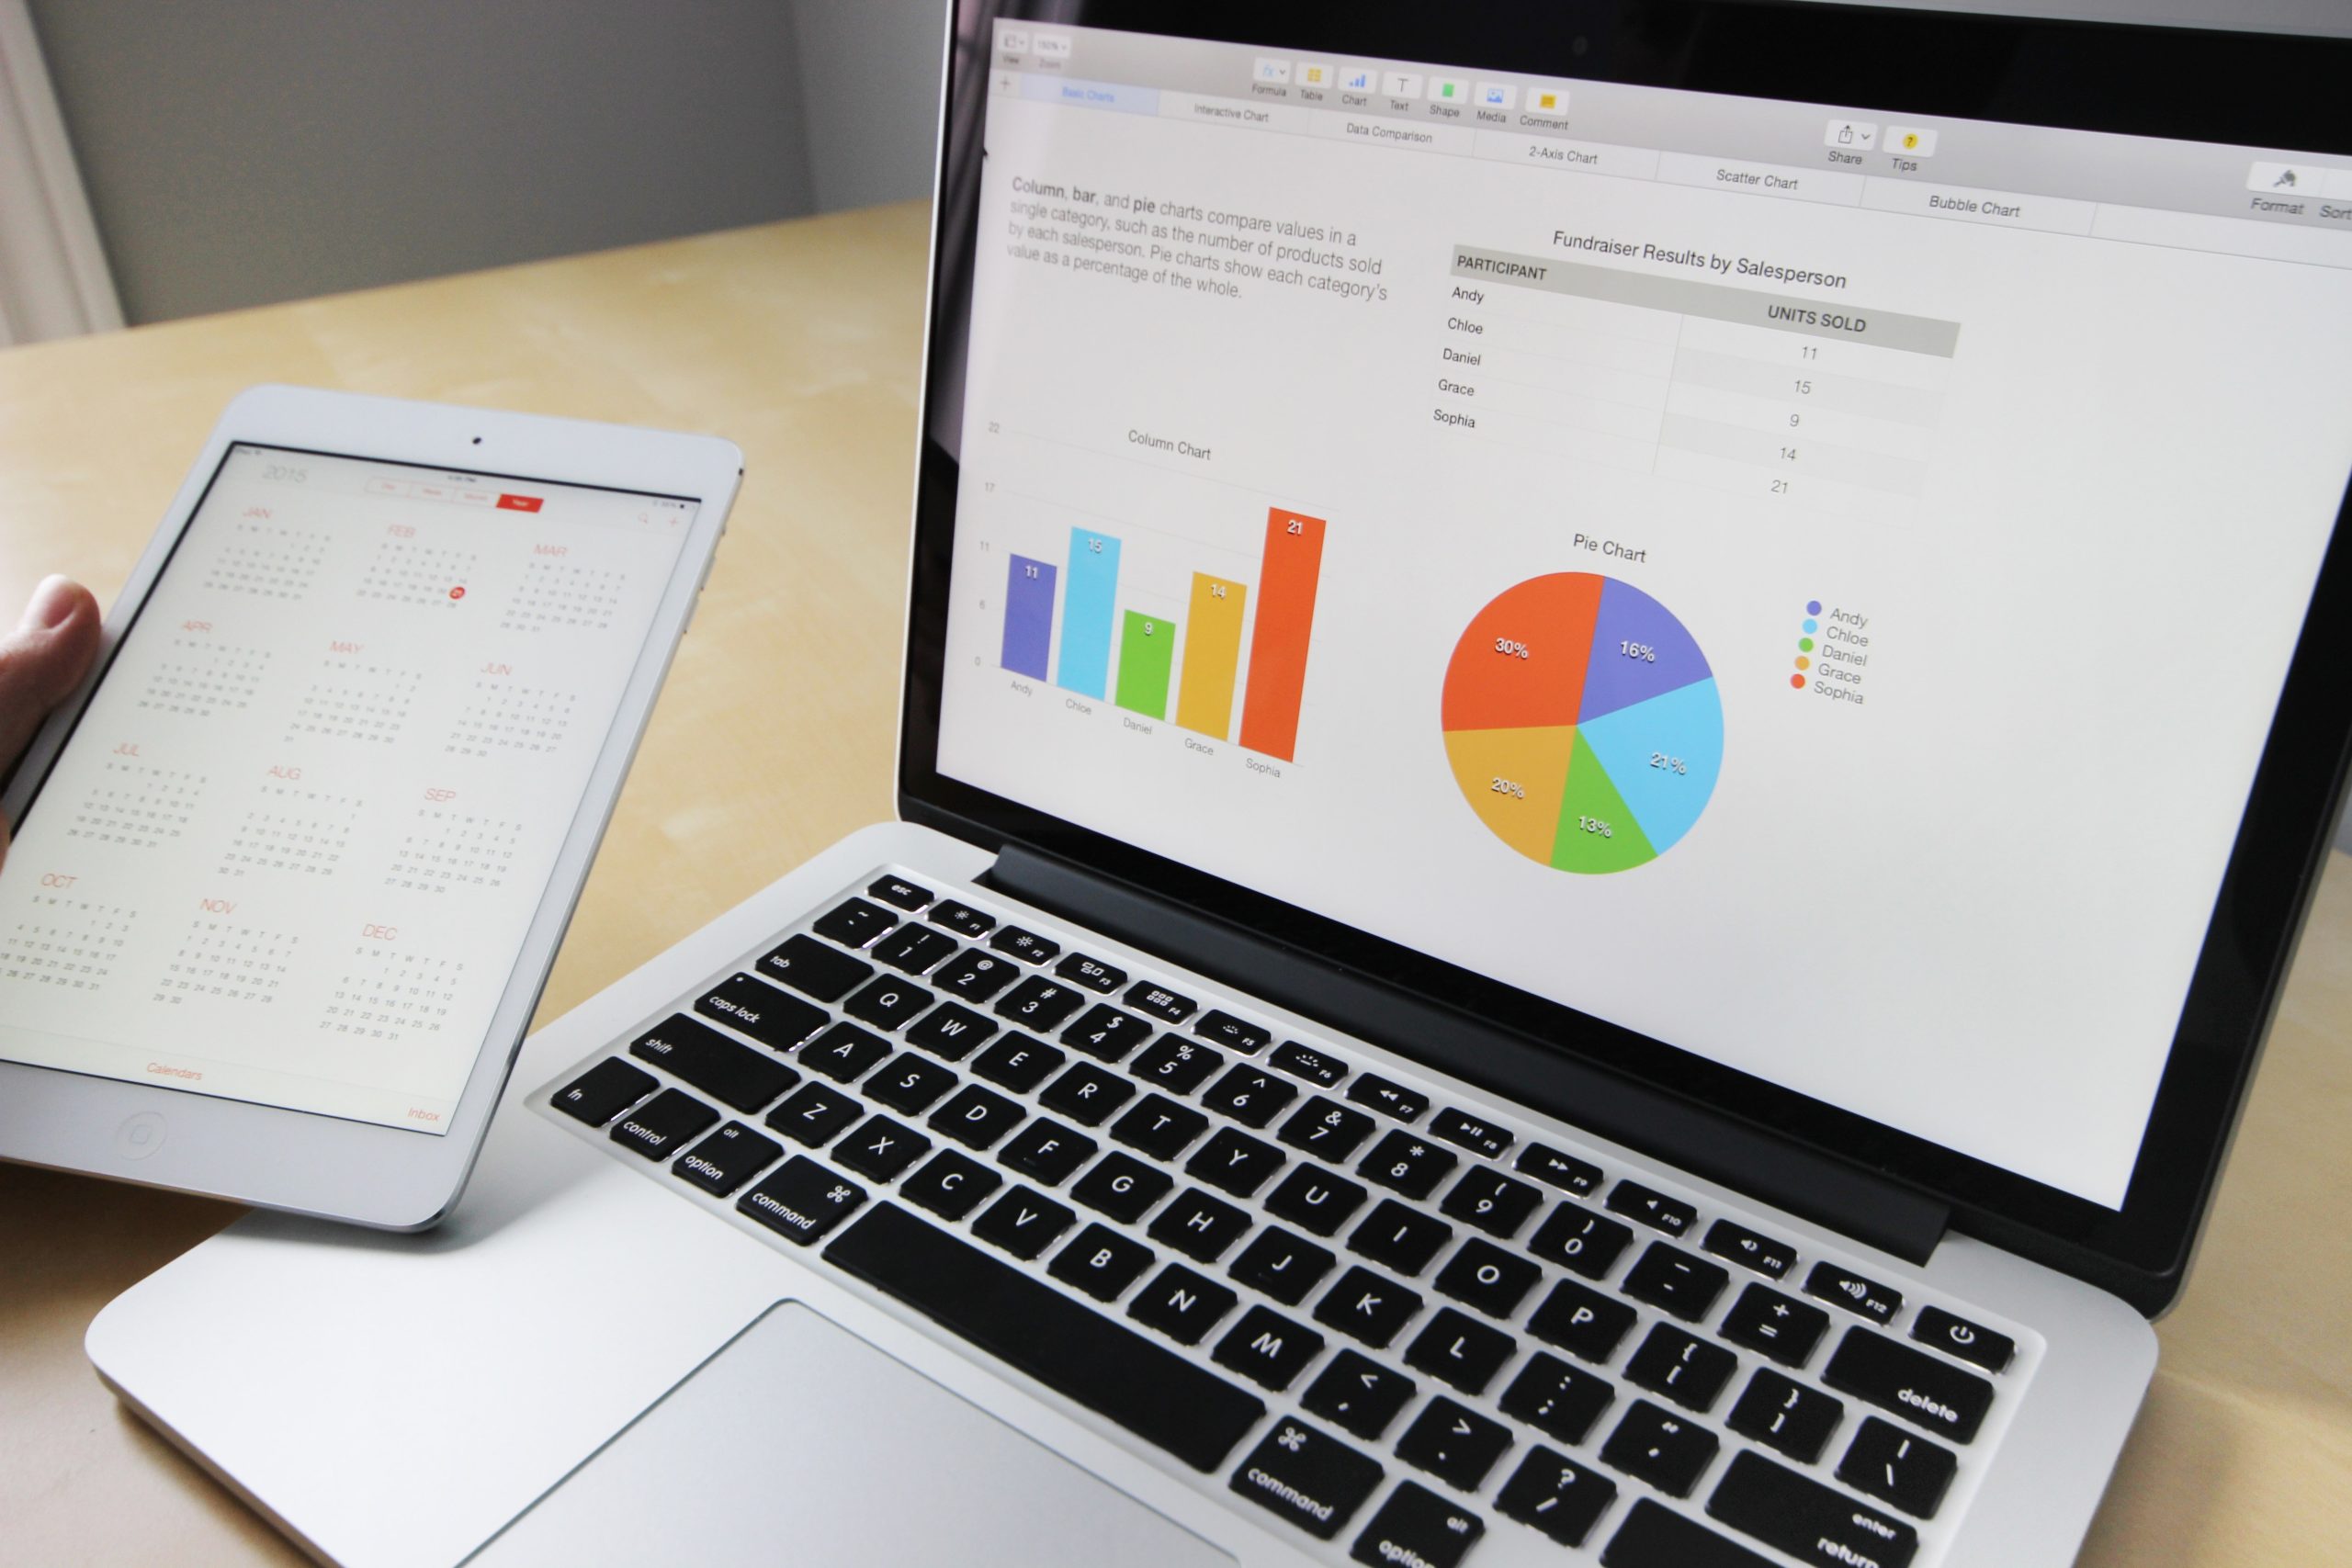
In today’s world data is everywhere. It has become quite crucial for a better understanding of the business. With so much data in hand, it is difficult to process and analyze it. This is where Irene Consulting Firm can help you. We are experts in visualizing data for you so that you know the ins and outs of your business. We know the importance of data and how powerful it can be if analyzed and studied properly. From figuring out the causes of the downfall of your business to what product is getting you the most revenue, data visualization lets you understand everything about your business and its performance in the market. Organizing and Visualizing such complex and large amounts of data is no easy task. Irene Consulting Firm with its team of expert consultants will take that load off your mind.
How is Data Visualization helpful?
Clarity
Reading this large number of data can be overwhelming and difficult to understand. Understanding the patterns and the logic behind all the data can be useful only when you simplify it into readable graphs and numbers. Dealing with these numbers is no joke and taking help from professionals will make the task easier.
Getting the right information
Stakeholders need better and detailed information to invest in your company and data visualization gives them the ease of getting their questions answered. Data can provide all the information you want from sales to shares and debt. They can get a complete picture of the company before investing. Data visualization gives them a deeper understanding of the company which makes the communications more clear and concise.
Decision-Making
Understanding the overall performance of the company in detail is very difficult without data visualization. Which asset is performing well, which asset is slowing down the production, what products should be discontinued, etc. all these crucial questions can be answered easily with data visualization. You can figure out anything and make a well-informed decision. With data, the decision-making process becomes easier and better.
Why Irene Consulting?
Customized Solutions
Every business is unique and requires solutions customized to its problems. Irene Consulting Firm provides unique solutions for your business so that you have a better understanding of your business. Our experts will be able to overcome any challenge while working with your firm.
Team of Expert Consultants
Irene Consulting Firm has a team of expert consultants who have been in this industry for quite some time. They are very well-trained and have a lot of experience so they can handle any challenge while visualizing data for you. They will not let you down at any cost.
Efficient
When it comes to visualizing data, it could take a lot of time and you might need the solution sooner. If so, don’t worry, Irene Consulting Firm is very efficient. With so many years in this business, our analysts are very good at their jobs and that is why they are very quick and efficient. Respecting your time is very important for us.Your Trusted Partner
Data Visualization is no longer for big companies, even small companies can benefit from data visualization. We swear by our services, and we know we will be able to provide you with the solution that you need through analyzing and interpreting your data. Understanding your firm and getting all the insights can help your business soar high.
Experience the power of information with Irene Consulting Firm as your trusted data visualization partner. With our analysts by your side analyzing every single data of your business and providing all the useful insights, you will be able to make every decision with more certainty. We at Irene Consulting Firm believe that having the power of data visualization is crucial for every business whether big or small.
To hire us as your consulting partner, just click on the “Contact Us” tab on our website.
Contact Irene Consulting Firm today!
